




Non-Listed Closed-End Funds Top $261B as Interval Credit Liquidity Cycle Deepens
The non-listed closed-end fund marketplace reached a record $261 billion in aggregate net asset value (NAV) in the second quarter of 2026, marking a 4.0% quarter-over-quarter expansion. According to the latest data from investment banking and research firm Robert A. Stanger & Company, interval funds grew 2.2% to $136.0 billion, while tender offer funds jumped 6.1% to $125.1 billion. Stanger now tracks 308 effective funds, split between 173 interval and 135 tender offer structures.
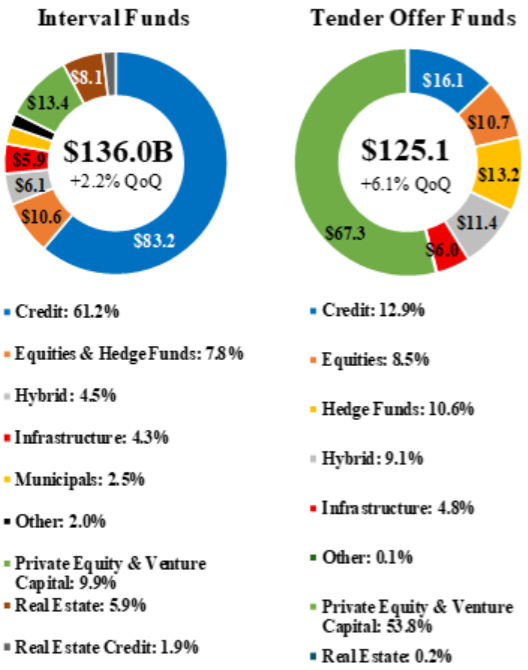
A core component of the expansion is Stanger’s newly introduced fund-level redemption tracking, which highlights how alternative managers navigate liquidity constraints. Across the 25 largest credit interval funds, met redemptions averaged 5.0% of corresponding NAV in the most recent reporting cycle, a slight decrease from 5.4% in preceding quarters. Year-to-date, these 25 dominant credit funds have returned nearly $6.4 billion to retail and institutional investors.
The most notable liquidity test occurred at the Cliffwater Corporate Lending Fund, the industry’s largest interval fund with over $30 billion in NAV. Stanger estimates that Cliffwater received redemption requests equal to 17% of its NAV in its most recent offering period.
Adhering to strict program parameters, the fund repurchased its standard 5% cap—equivalent to $1.6 billion—satisfying roughly 29% of investor requests. In the prior quarter, Cliffwater had expanded its liquidity gates to 7%, returning $2.3 billion.
“The private credit liquidity cycle extends beyond BDCs,” Kevin T. Gannon, Chairman & CEO of Stanger, said. “Sponsors are continuing to return capital within defined program limits, while proration is occurring where requests exceed those limits. That is how semi-liquid structures are designed to function.”
Year-to-date gross fundraising through May 2026 remained flat at $30.5 billion compared to $30.6 billion during the same period last year. Interval funds captured $14.2 billion, with credit strategies accounting for 59% ($8.4 billion) of sales.
Tender offer funds pulled in $16.3 billion, led by private equity and venture capital strategies at 54% ($8.7 billion). Private equity and venture capital strategies also dominated performance, capturing seven of the top 10 interval fund spots over the trailing three-month period.
